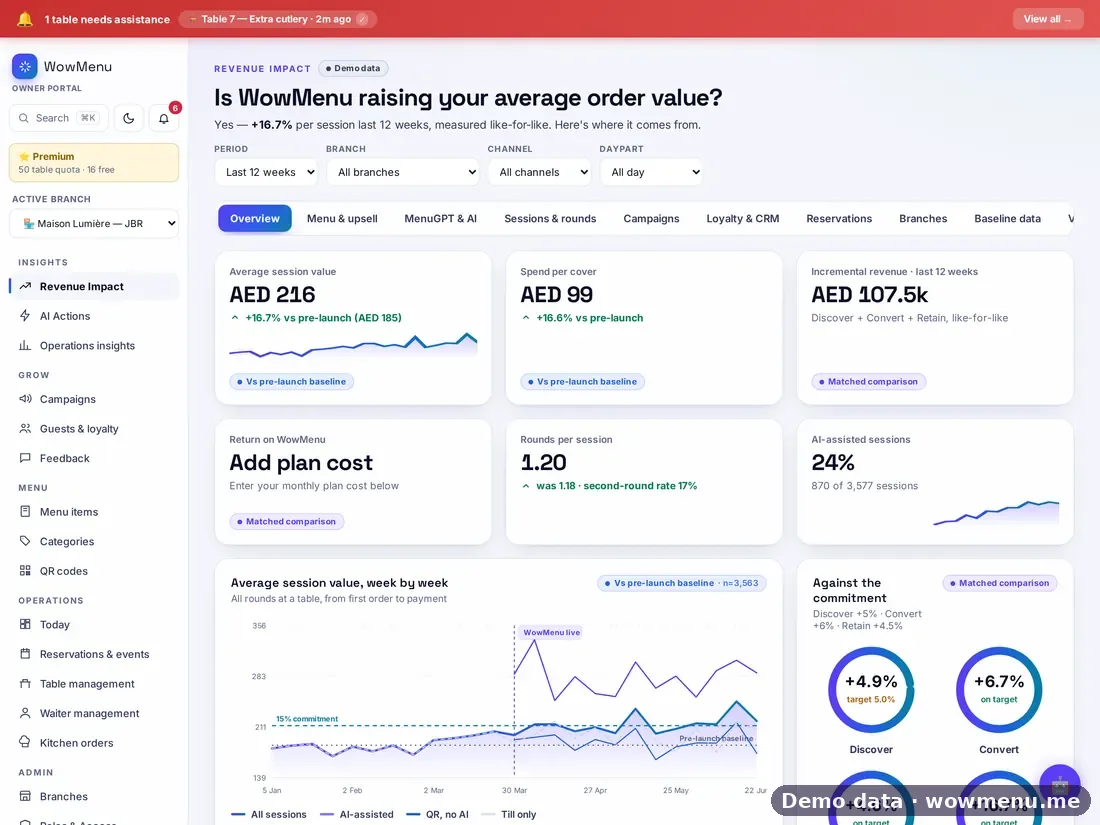
Revenue Impact is the page the owner opens to answer the only question that matters: is this paying off? It compares each week with the restaurant's own pre-launch baseline, and it compares like with like, so a busy Friday is never measured against a quiet Tuesday.
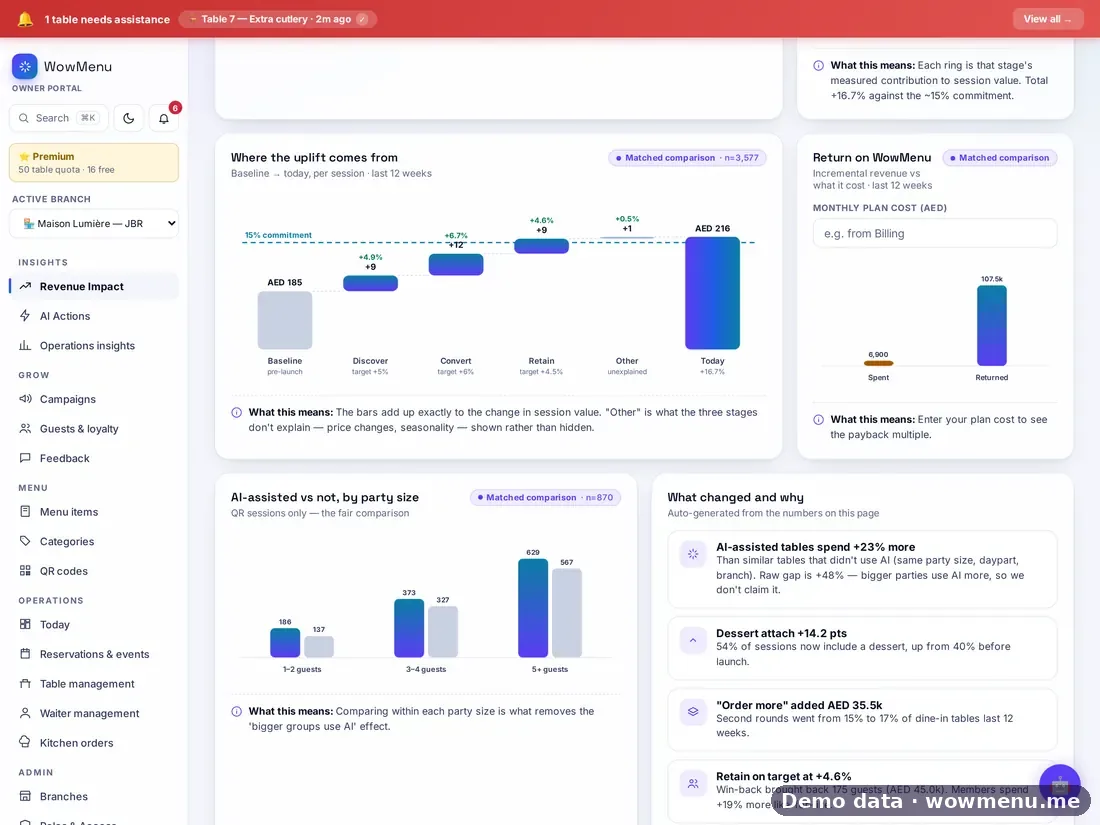
The headline is the average value per table before WowMenu and now, and the change. A waterfall splits that change into Discover, Convert and Retain, plus anything unexplained, and the parts add up exactly to the whole. Every figure carries a label that says what kind of evidence it is: against the pre-launch baseline, a matched comparison, attributed to a campaign, or a projection.
Most tools stop at more orders. Revenue Impact shows what changed, why, and whether it was worth it, so at the end of your 30-day trial you decide on evidence, not on a sales promise.
Revenue Impact is described here from our demo restaurant, Maison Lumière. No figure on this page is a customer result. Customer results are published only once they have been measured with a real restaurant.
Every number says what kind of evidence it is
Revenue Impact labels each figure, so you always know how much weight it can bear. Tap a label.
Compared with your own sales from before WowMenu, compared like for like.
Used on: Average session value and spend per cover.
How it connects
What the owner sets up or sees in the portal, and what the guest sees in the QR menu. Screens are from the demo restaurant, Maison Lumière, with demo data.
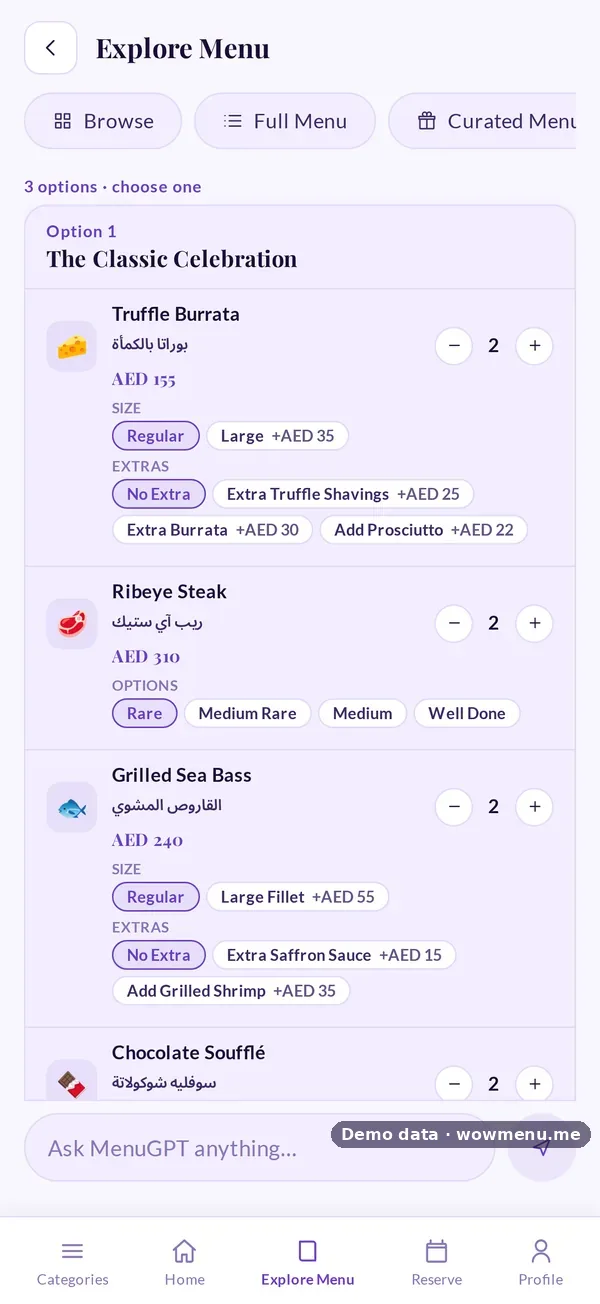
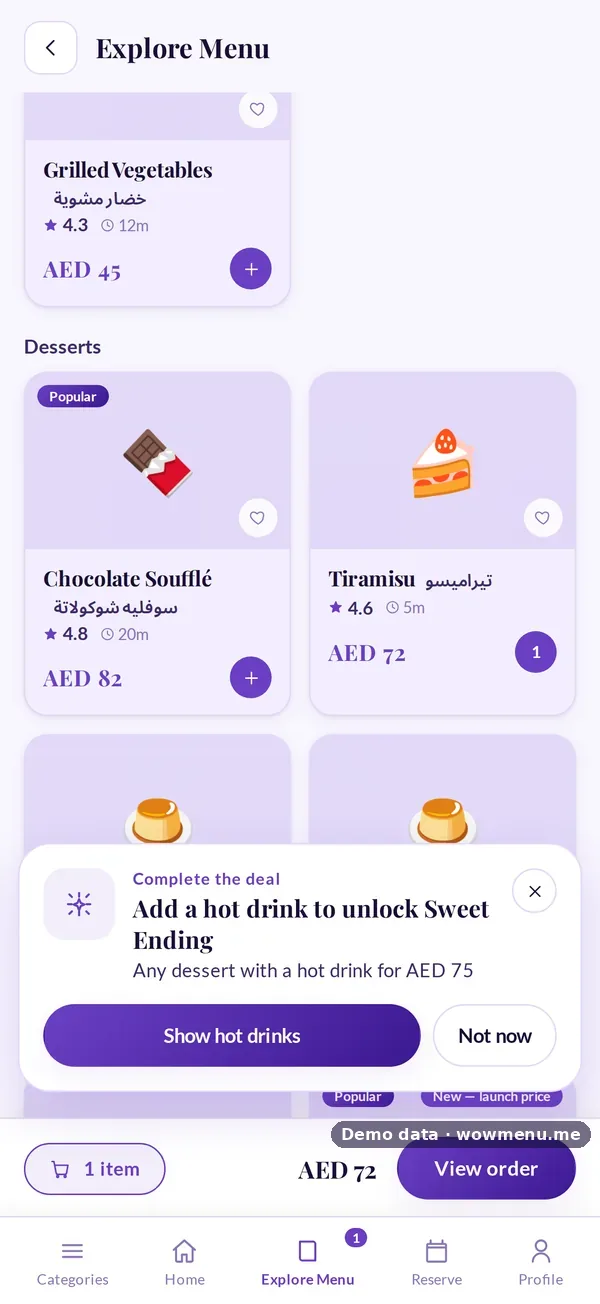
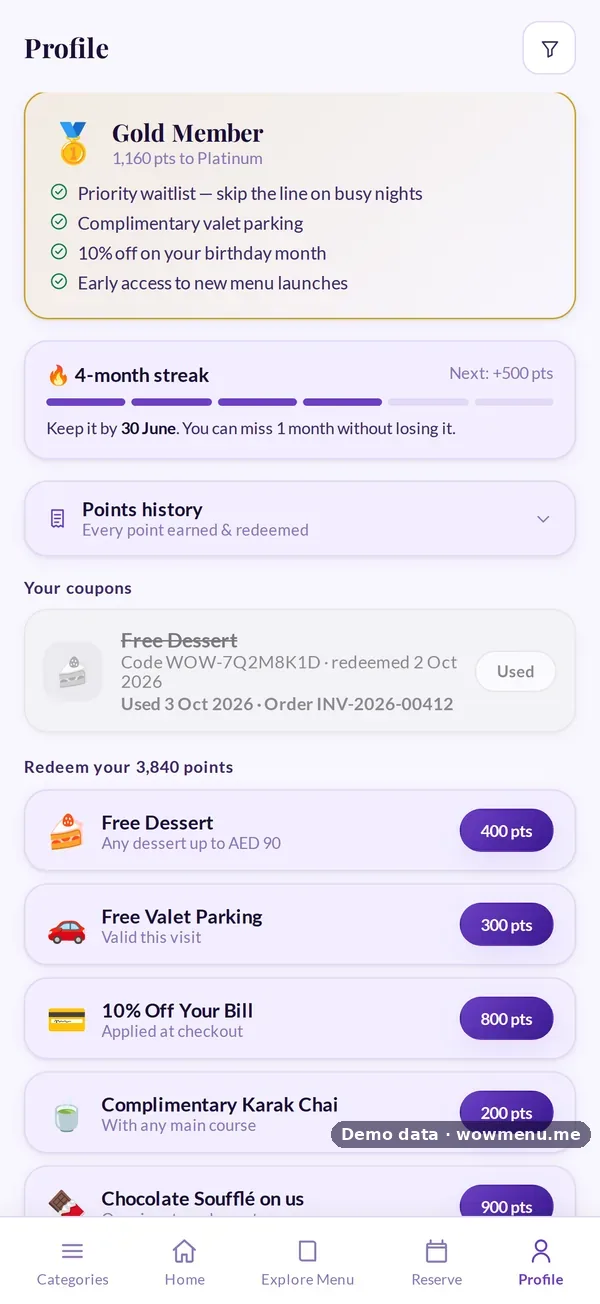
The guest features it measures
Revenue Impact splits the change in average session value into Discover, Convert and Retain. The guest features behind those stages are MenuGPT, slide-up offers and loyalty.
Key benefits
What Revenue Impact does for your restaurant
Your own baseline, like for like
Each week is compared with your pre-launch baseline, and matched against comparable days, so busy and quiet services are never mixed.
A waterfall that adds up
The change is split into Discover, Convert and Retain, plus anything unexplained. The parts add up exactly to the whole.
Every figure labelled with its evidence
Against the pre-launch baseline, a matched comparison, attributed to a campaign, or a projection. You always know how much weight a number can bear.
Ten views and a monthly Value report
Overview, Menu and upsell, MenuGPT and AI, Sessions and rounds, Campaigns, Loyalty and CRM, Reservations, Branches, Baseline data, and a one-page Value report you can print or export.
How it works
Start from your own history
Upload past sales at one of three levels of detail: bill and items, bill only, or daily totals. WowMenu checks the file against 13 validation rules and normalises VAT and service charge.
Lock the baseline
The baseline is locked with an audit trail, so later weeks are compared with a fixed reference. Before you have measured weeks, you see a projection clearly labelled as not measured.
Go live and compare
Each week is compared with the baseline like for like. A target line of around 15% shows progress against the commitment. It is a target, not a result.
Decide on evidence
Charts show the weekly trend, attach rates before and after, the MenuGPT funnel from scan to paid order, and tables that used AI against tables that did not.
These counts describe the product. They are not customer results.
Frequently asked
Are the numbers shown for Revenue Impact customer results?
No. Revenue Impact is shown with demo data from our demo restaurant. Customer results are published only once they have been measured with a real restaurant.
What is the baseline?
Your own sales history from before WowMenu, uploaded at the level of detail you have. It is validated and locked with an audit trail.
What does like for like mean?
Weeks are compared with comparable periods, so a busy Friday is never measured against a quiet Tuesday.
What do the evidence labels mean?
Each figure says whether it is measured against your pre-launch baseline, comes from a matched comparison, is attributed to a campaign, or is a projection.
Is the 15% a promise?
No. Around 15% is a target line so you can see progress against it. What Revenue Impact reports is measured against your own baseline, and it can be higher or lower.
Can I see a projection before I go live?
Yes. A projection from your own sales is labelled not measured, and is replaced by measured weeks as they come in. See the projected uplift page to get started.